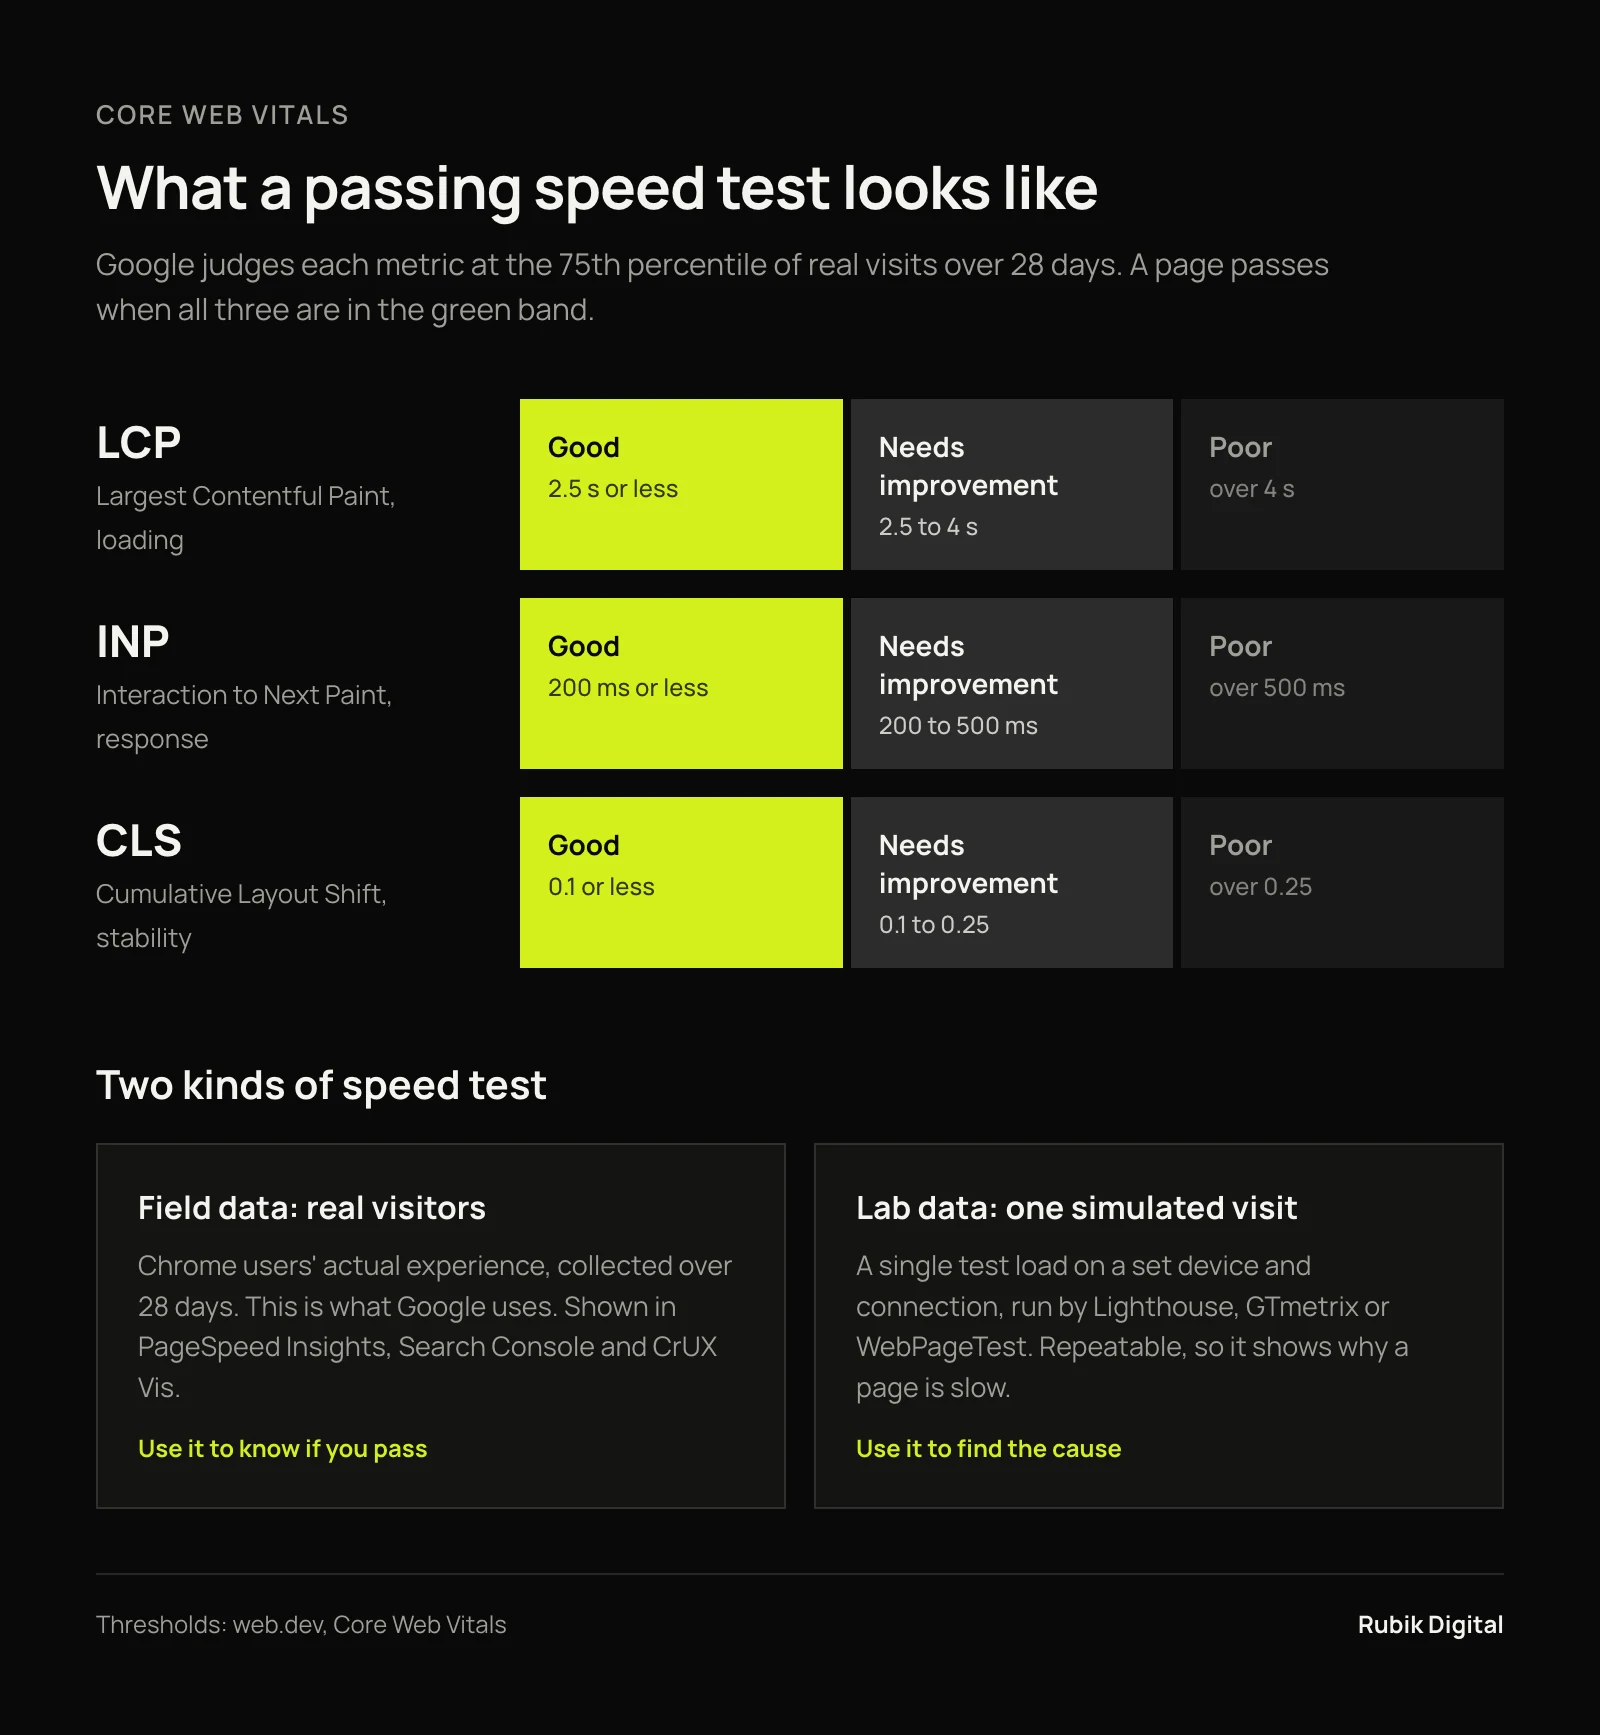
A website speed test tells you two different things, and most people only read one of them. Field data is what real visitors experienced over the past 28 days, and it decides whether you pass Google's Core Web Vitals. Lab data is a single simulated visit, and it explains why a page is slow. You need both.
This guide covers the free tools worth using, how to run a test that gives a reliable answer, how to read the results and how to fix the problems that come up most often.
The 7 best free website speed test tools
| Tool | Data | Best for |
|---|---|---|
| PageSpeed Insights | Field and lab | The first test for any page; shows if you pass Core Web Vitals |
| Search Console Core Web Vitals report | Field | Every page on your site, grouped, with trends |
| CrUX Vis | Field | 40 weeks of history for a page or whole site |
| Chrome DevTools (Lighthouse and Performance) | Lab | Debugging on your own machine, step by step |
| GTmetrix | Lab | Waterfall charts and a filmstrip of how the page loads |
| WebPageTest | Lab | Detailed tests from chosen locations, devices and connections |
| DebugBear free test | Field and lab | A quick second opinion with clear request breakdowns |
1. Google PageSpeed Insights
PageSpeed Insights is the place to start. The top section, "Discover what your real users are experiencing", shows field data from the Chrome UX Report for that page and for your whole site, with a pass or fail for Core Web Vitals. Below it is a Lighthouse lab test with a score out of 100 and a list of specific fixes.
2. Search Console Core Web Vitals report
Search Console's Core Web Vitals report groups similar pages, such as all your blog posts, and shows which groups are good, need improvement or are poor on mobile and desktop. It is the best way to see whether a problem is one page or a whole template. See our Search Console guide.
3. CrUX Vis
CrUX Vis is Google's tool for charting field data over time, with 40 weeks of history updated every Monday. It replaced the old CrUX Dashboard, which Google retired at the end of November 2025. Use it to confirm a fix actually improved things for visitors.
4. Chrome DevTools
Open DevTools in Chrome, then the Lighthouse panel to run the same lab test as PageSpeed Insights on your own machine, or the Performance panel to record a page load and see exactly which scripts and images take the time. It is the most useful tool once you know which page to fix.
5. GTmetrix
GTmetrix runs a Lighthouse-based test and adds a waterfall chart showing every file the page loads, in order, with timings. It is good for spotting one oversized image or a slow third-party script holding up everything else.
6. WebPageTest
WebPageTest is the most detailed of the lab tools. You can choose the test location, browser, device and connection speed, run several tests and compare them side by side. It suits developers more than marketers.
7. DebugBear
DebugBear's free speed test shows both field data and a lab test, with a clear breakdown of requests and render-blocking resources. It is a useful second opinion when PageSpeed Insights results look odd.
How to run a speed test properly
- Test mobile first. Google indexes the mobile version of your site, and phones are where slow pages hurt most.
- Test your key templates, not just the homepage. A service page, a blog post, a product page and the contact page often behave very differently.
- Run each lab test three times. Use the middle result. A single run can be off by several seconds.
- Test the live site, logged out. Admin bars, staging servers and logged-in sessions skew results.
- Pick a location near your customers where the tool allows it, such as London for UK visitors.
- Write the results down. Record the date, the field data and the lab metrics so you can compare after making changes.
How to read the results
Field data decides whether you pass
Google judges each Core Web Vital at the 75th percentile of real visits: three-quarters of visits need to hit the good threshold. A page passes when LCP is 2.5 seconds or less, INP is 200 milliseconds or less and CLS is 0.1 or less. If the field data section says "Passed", Google considers the page fast, whatever the score below says.
The Lighthouse score is a lab estimate
The score out of 100 comes from five lab metrics. Since Lighthouse 10 the weights are Total Blocking Time 30%, Largest Contentful Paint 25%, Cumulative Layout Shift 25%, First Contentful Paint 10% and Speed Index 10%. Time to Interactive, which older guides still mention, was removed in 2023. A score of 90 or more is good, but it is not a ranking factor in itself.
When field and lab disagree
It is common to see a lab score of 60 with passing field data, or the reverse. The lab test simulates a mid-range phone on a slow connection; your real visitors may be on faster devices, or slower ones. Trust the field data for whether there is a problem, and use the lab test to find the cause.
Common causes of a slow website, and how to fix them
| Problem | Usually caused by | Fix |
|---|---|---|
| Slow LCP | Large hero image, slow server response, render-blocking CSS or fonts | Compress and resize the hero image, serve WebP or AVIF, don't lazy-load it, improve hosting or caching |
| Slow INP | Heavy JavaScript, page builders, chat widgets and tag managers | Remove unused scripts, delay non-essential third-party tags, break up long tasks |
| Poor CLS | Images without dimensions, late-loading fonts, banners pushing content down | Set width and height on images, reserve space for embeds and banners, preload key fonts |
| Slow server response (TTFB) | Cheap shared hosting, no page caching, slow database queries | Page caching, a CDN, better hosting, fewer heavy plugins |
Our Core Web Vitals guide explains each metric and its fixes in more depth. On WordPress, hosting and plugins cause most problems; see our guide to managed WordPress hosting.
“Most slow sites we audit aren't slow because of the code. They're slow because of twelve marketing scripts nobody remembers adding. Remove what you don't use before you optimise what you do.”
Does website speed affect SEO?
Yes, but it is a tie-breaker rather than a trump card. Core Web Vitals are part of Google's page experience signals, and Google has said a good page experience is in line with what its ranking systems reward. A slow page with the best answer can still outrank a fast page with a weaker one. The bigger effect is on people: faster pages keep more visitors and turn more of them into enquiries.
Website speed checklist
- Core Web Vitals pass in field data on mobile for your key templates.
- Hero images are compressed, correctly sized and not lazy-loaded.
- Every image has width and height set.
- Unused plugins, scripts and tags are removed.
- Third-party scripts load after the main content.
- Pages are cached, and static files are served from a CDN.
- Hosting responds quickly from the UK.
Related: our technical SEO service and common technical SEO issues and how to fix them.